



Every podcaster eventually asks the same question: is my show any good? Downloads alone don’t answer it. What answers it is knowing where your numbers sit against everyone else’s, over a defined window, on a defined metric. Here’s what that actually looks like in 2026.
The window matters more than the number
Two shows can both claim “5,000 downloads an episode” and mean completely different things. One means 5,000 in the first seven days. The other means 5,000 accumulated over a year across a back catalog. The industry standard for benchmarking — and for ad sales — is downloads in a fixed window after release, either the first 7 days or the first 30.
Seven days is the tighter, more honest read. Most shows collect the large majority of an episode’s lifetime downloads inside that first week. Thirty days is what most advertisers price against, since it captures the tail from listeners who binge or catch up on a backlog.
Audio benchmarks: first 7 days
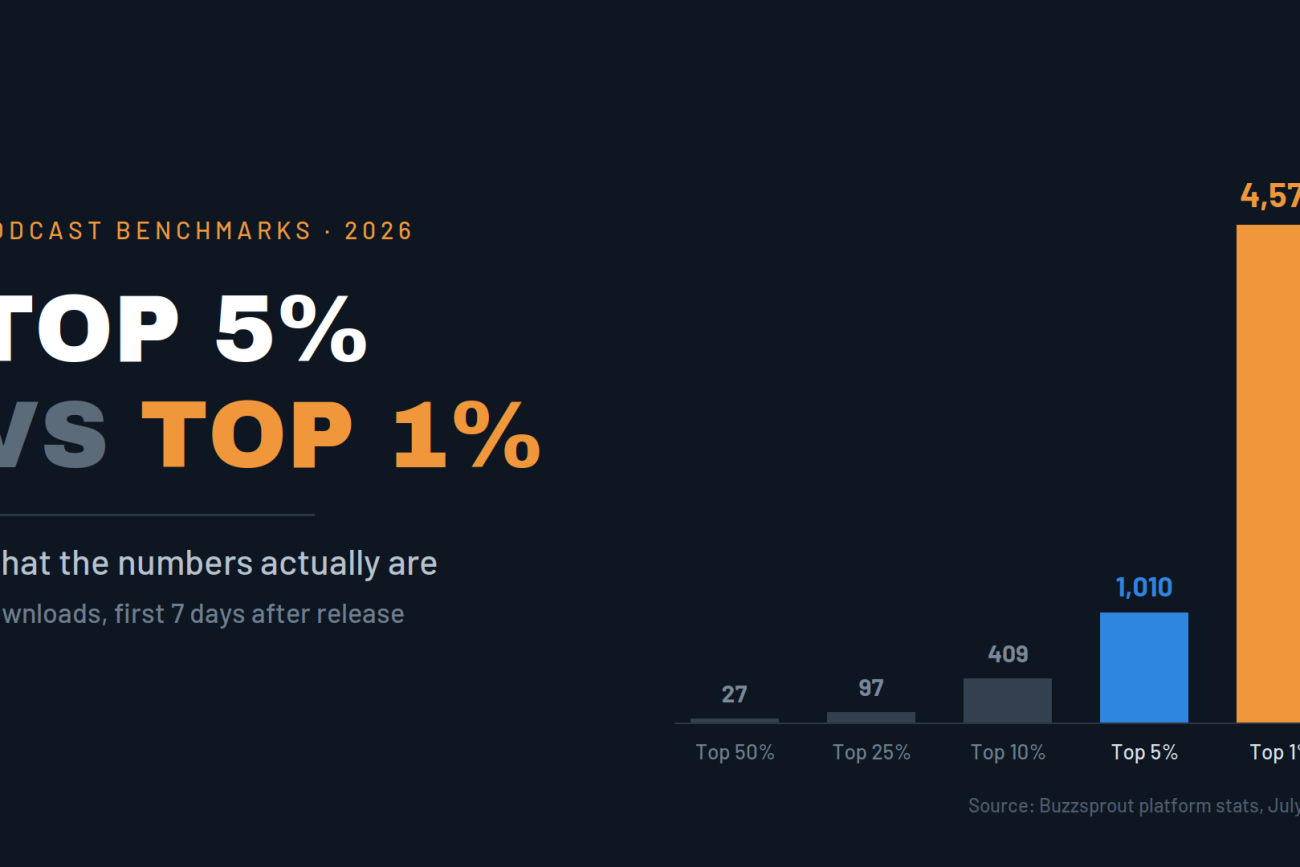
Buzzsprout publishes live percentile data drawn from more than 112,000 active shows and roughly 88 million monthly downloads, measured to IAB Podcast Measurement Technical Guidelines 2.2. As of July 2026, here’s the ladder for downloads in the first seven days after release:
- Top 50% (the median show): 27 downloads
- Top 25%: 97 downloads
- Top 10%: 409 downloads
- Top 5%: 1,010 downloads
- Top 1%: 4,579 downloads
Read that median again. Twenty-seven downloads in a week beats half the podcasts on earth. The distribution isn’t a bell curve — it’s a cliff. Going from the top 25% to the top 5% means multiplying your audience roughly tenfold. Going from top 5% to top 1% means multiplying it by four or five again.
Audio benchmarks: first 30 days
Libsyn’s numbers run substantially higher because its customer base skews toward larger, established, professionally produced shows. Historically, Libsyn has put the median around 150 downloads in 30 days, the top 5% near 6,600, and the top 1% north of 30,000.
The gap between the two datasets isn’t a contradiction — it’s a sampling difference. Buzzsprout is heavy with independents and new shows. Libsyn is heavy with networks. If you want a defensible single number, a healthy show typically lands somewhere between 1.5x and 2x its 7-day figure by day 30. So a top 5% show is roughly 1,000 downloads in week one and 2,000 to 6,000 by day 30, depending on which universe you’re comparing against.
One useful coincidence: 5,000 downloads per episode has long been the informal threshold where national advertisers start taking calls. That lands almost exactly on the top 1% line for 7-day performance. The ad market and the percentile chart agree on where “real” begins.
Video changes the math
The percentile tables above are audio-only, and audio-only is now an incomplete picture. YouTube is the single most-used platform for podcast consumption, and it hosts roughly 81% of all video podcast viewership. Watch time on living-room devices — smart TVs and connected TV boxes — grew about 75% in a single year.
There is no clean percentile table for video podcasts, and anyone who shows you one built it from proxies. What the available data does show:
- Platform-wide, the average YouTube video pulls around 687 views, but that figure is badly inflated by Shorts and passive TV viewing. It’s not a useful benchmark for long-form.
- Massive audio brands do not automatically translate. NPR, one of the largest podcast publishers in the world, averages under 200 views per YouTube episode.
- Video inventory prices higher. Video podcast CPMs run around $18.60 against roughly $12.40 for audio.
The practical takeaway: a top 5% audio show with 1,000 weekly downloads and 300 YouTube views per episode is normal. A show with 1,000 downloads and 25,000 views per episode is running a fundamentally different business.
What separates top 5% from top 1% is distribution, not content
This is the part most benchmark articles skip. The jump from top 5% to top 1% is rarely a matter of the show getting four times better. It’s a matter of the show being available on four times as many surfaces.
Podtrac’s multi-channel ranker, which now counts audio downloads, full-episode video on YouTube and Spotify, and clips on Instagram, TikTok and YouTube Shorts, makes this visible. Among the top shows, the consumption mix varies wildly. The MeidasTouch Podcast draws something like 43% of its total consumption from short video clips. Joe Rogan’s audience splits roughly evenly between audio and video, with only about 9% coming from clips. The New York Times’ The Daily is almost entirely audio. Candace Owens’ show is mostly video and clips, split about evenly.
Four different shows, four completely different distribution architectures, all at the top of the same chart. There is no single correct stack — but every one of them is running more than one channel.
A realistic profile of each tier:
Top 5% — Roughly 1,000 downloads in week one. Consistent weekly publishing. A real RSS feed distributed to Apple and Spotify, one strong secondary platform, and some social presence. Usually one person or a small team. Monetizable through direct-sold local or endemic sponsors, rarely through programmatic networks.
Top 1% — Roughly 4,500 to 5,000 downloads in week one, 25,000 to 30,000 in 30 days. Audio feed plus full-episode video plus a deliberate clip operation across two or three short-form platforms. Frequently an owned email list. Increasingly a connected TV presence. This tier clears the threshold where national ad networks, host-read CPM deals and rep firms become available.
Top 0.1% — A different universe entirely. The largest shows measure in the tens of millions of monthly downloads and views combined across all platforms, with per-episode figures in the millions. These are media companies, not podcasts.
Two things that reliably move the number
Cadence is the most underrated lever. About 34% of shows publish every three to seven days, and weekly shows have been shown to outperform monthly or irregular shows by more than 60% in downloads. Publishing schedule is a distribution decision, not a production one.
Format length matters less than people think. Thirty percent of episodes run 20 to 40 minutes, and that band performs fine. Nobody is failing because their episodes are the wrong length.
The caveat worth noting
A download is a file request, not a human being. IAB 2.2 filtering removes most of the obvious junk, but downloads still overstate listeners, and a YouTube view is not remotely the same unit as a download. Don’t add them together and call it audience — that’s how shows end up quoting numbers they can’t defend when a buyer asks for a third-party verified report.
The honest version: measure downloads in a fixed window, report video separately, and grow the number of places your show exists. That last one is what actually separates the tiers.